List of National Hockey League attendance figures
The National Hockey League is one of the top attended professional sports in the world, as well as one of the top two attended indoor sports in both average and total attendance. As of the 2018–19 season the NHL averaged 18,250 live spectators per game, and 22,002,081 total for the season.[ 1] [failed verification
Season Leaders
Year
Team
Arena
Home Games
Average Attendance
Total Attendance
Capacity Percentage
2023–24
Montreal Canadiens
Bell Centre
41
21,099
865,074
100.0[ 2]
2022–23
41
21,078
864,180
100.0[ 3]
2021–22
Tampa Bay Lightning
Amalie Arena
41
19,092
782,772
100.0[ 4]
2020-21 *
Dallas Stars
American Airlines Center
28
4,341[ 5]
121,534
23.4%[ 6]
2019-20
Chicago Blackhawks
United Center
34
21,441
729,000
108.7%[ 7]
2018-19
40
21,399
855,972
108.5%[ 8]
2017-18
41
21,653
887,794
109.8%[ 9]
2016-17
41
21,751
891,827
110.3%[ 10]
2015-16
41
22,859
896,240
110.9% [ 11]
2014-15
41
21,769
892,532
110.4% [ 12]
2013-14
41
22,623
927,545
117.6% [ 13]
2012-13
24
21,755
522,619
110.4% [ 14]
2011-12
41
21,533
882,874
109.2% [ 15]
2010-11
41
21,423
878,356
108.7%[ 16]
2009-10
40
21,356
854,267
108.3%[ 17]
2008-09
41
22,247
912,155
111.2%[ 18]
2007-08
Montreal Canadiens
Bell Centre
41
21,273
872,193
100.0%[ 19]
2006-07
41
21,273
872,193
100.0%[ 20]
2005-06
41
21,273
872,194
—[ 21]
2004-05
No season due to 2004–05 NHL lockout
2003-04
Montreal Canadiens
Bell Centre
41
20,555
842,767
—[ 22]
2002-03
41
20,672
847,586
—[ 23]
2001-02
Detroit Red Wings
Joe Louis Arena
41
20,058
822,378
—[ 24]
2000-01
Montreal Canadiens
Bell Centre
41
20,105
824,308
—[ 25]
* Attendance capacity partially reduced due to government Covid-19 restrictions[ 26]
Team
Arena
Home Games
Average Attendance
Total Attendance
Capacity Percentage
1.
Montreal Canadiens
Bell Centre
41
21,099
865,074
100.0
2.
Edmonton Oilers
Rogers Place
41
19,173
786,091
97.9
3.
Tampa Bay Lightning
Amalie Arena
41
19,092
782,772
99.4
4.
Detroit Red Wings
Little Caesars Arena
41
18,980
778,167
95.6
5.
Chicago Blackhawks
United Center
41
18,836
772,257
93.8
6.
Vancouver Canucks
Rogers Arena
41
18,826
771,876
99.6
7.
Carolina Hurricanes
PNC Arena
41
18,798
770,736
100.6
8.
Toronto Maple Leafs
Scotiabank Arena
41
18,789
770,342
99.8
9.
Florida Panthers
BB&T Center
41
18,632
763,931
96.8
10.
Dallas Stars
American Airlines Center
41
18,532
759,812
100.0
11.
Minnesota Wild
Xcel Energy Center
41
18,526
759,586
103.8
12.
Philadelphia Flyers
Wells Fargo Center
41
18,438
755,962
94.4
13.
Vegas Golden Knights
T-Mobile Arena
41
18,139
743,680
103.6
14.
Colorado Avalanche
Pepsi Center
41
18,103
742,206
100.5
15.
New York Islanders
UBS Arena
41
18,099
742,042
96.7
16.
St. Louis Blues
Enterprise Center
41
18,084
741,461
98.3
17.
New York Rangers
Madison Square Garden
41
17,983
737,296
99.9
18.
Los Angeles Kings
Staples Center
41
17,945
735,725
99.0
19.
Pittsburgh Penguins
PPG Paints Arena
41
17,909
734,252
97.4
20.
Seattle Kraken
Climate Pledge Arena
41
17,887
733,353
100.2
21.
Boston Bruins
TD Garden
41
17,850
731,850
101.6
22.
Washington Capitals
Capital One Arena
41
17,841
731,483
96.4
23.
New Jersey Devils
Prudential Center
41
17,598
721,529
97.1
24.
Ottawa Senators
Canadian Tire Centre
41
17,580
720,778
94.2
25.
Calgary Flames
Scotiabank Saddledome
41
17,501
717,561
90.7
26.
Nashville Predators
Bridgestone Arena
41
17,306
709,559
101.1
27.
Columbus Blue Jackets
Nationwide Arena
41
17,016
697,667
93.8
28.
Buffalo Sabres
KeyBank Center
41
15,981
655,203
83.8
29.
Anaheim Ducks
Honda Center
41
15,687
643,150
91.3
30.
San Jose Sharks
SAP Center
41
13,559
555,934
77.8
31.
Winnipeg Jets
Bell MTS Place
41
13,490
553,107
89.9
32.
Arizona Coyotes
Mullett Arena
41
4,600
188,600
100.0
Total
1,312
17,434
22,873,042
Team
Arena
Home Games
Average Attendance
Total Attendance
Capacity Percentage
1.
Tampa Bay Lightning
Amalie Arena
41
19,092
782,772
100.0[ 27]
2.
Washington Capitals
Capital One Arena
41
18,573
761,493
100.4
3.
Minnesota Wild
Xcel Energy Center
41
18,542
760,226
100.4
4.
Nashville Predators
Bridgestone Arena
41
18,495
758,317
100.6
5.
Chicago Blackhawks
United Center
41
18,489
758,082
93.8
6.
Vegas Golden Knights
T-Mobile Arena
41
18,100
742,124
104.2
7.
Dallas Stars
American Airlines Center
41
17,896
733,769
96.6
8.
Boston Bruins
TD Garden
41
17,850
731,850
100.0
9.
St. Louis Blues
Enterprise Center
41
17,716
726,392
97.9
10.
Pittsburgh Penguins
PPG Paints Arena
41
17,684
725,046
97.2
11.
Colorado Avalanche
Pepsi Center
41
17,498
717,458
97.2
12.
Vancouver Canucks *
Rogers Arena
41
17,285
708,711
91.4
13.
Carolina Hurricanes
PNC Arena
41
17,210
705,611
92.1
14.
Seattle Kraken
Climate Pledge Arena
41
17,151
703,191
100.3
15.
Detroit Red Wings
Little Caesars Arena
41
16,984
696,367
87.0
16.
New York Islanders
UBS Arena
41
16,942
694,658
99.0
17.
New York Rangers
Madison Square Garden
41
16,839
690,411
93.5
18.
Philadelphia Flyers
Wells Fargo Center
41
16,540
678,163
84.7
19.
Columbus Blue Jackets
Nationwide Arena
41
16,237
665,722
89.5
20.
Toronto Maple Leafs *
Scotiabank Arena
41
15,586
639,039
82.8
21.
Montreal Canadiens *
Bell Centre
41
15,495
635,297
72.8
22.
Edmonton Oilers *
Rogers Place
41
14,927
612,010
80.1
23.
Los Angeles Kings
Staples Center
41
14,828
607,977
81.3
24.
Florida Panthers
BB&T Center
41
14,811
607,269
86.9
25.
Calgary Flames *
Scotiabank Saddledome
41
14,284
585,644
74.1
26.
Anaheim Ducks
Honda Center
41
13,083
536,403
76.2
27.
New Jersey Devils
Prudential Center
41
12,744
522,519
77.2
28.
Winnipeg Jets *
Bell MTS Place
41
12,716
521,357
84.8
29.
San Jose Sharks
SAP Center
41
12,573
515,533
71.6
30.
Arizona Coyotes
Gila River Arena
41
11,601
475,659
67.7
31.
Buffalo Sabres
KeyBank Center
41
9,997
409,908
53.7
32.
Ottawa Senators *
Canadian Tire Centre
41
9,155
375,368
54.4
Total
1,312
15,841
20,784,346
* Attendance capacity partially reduced due to government Covid-19 restrictions
Team
Arena
Home Games
Average Attendance
Total Attendance
Capacity Percentage
Chicago Blackhawks
United Center
34
21,441
729,000
108.7%[ 28]
Montreal Canadiens Bell Centre 37
21,085
780,155
99.1%
Dallas Stars American Airlines Center 34
20,326
691,084
113.0%
Toronto Maple Leafs Scotiabank Arena 34
19,301
656,261
102.6%
Tampa Bay Lightning Amalie Arena 34
18,922
643,375
99.9%
Calgary Flames Scotiabank Saddledome 33
18,751
618,783
97.2%
Detroit Red Wings Little Caesars Arena 37
18,716
692,515
95.9%
Colorado Avalanche Pepsi Center 33
18,708
617,380
107.1%
Vancouver Canucks Rogers Arena 35
18,679
653,790
98.8%
Washington Capitals Capital One Arena 33
18,570
612,842
100.4%
Pittsburgh Penguins PPG Paints Arena 35
18,537
648,813
100.8%
Philadelphia Flyers Wells Fargo Center 35
18,390
643,677
94.4%
Vegas Golden Knights T-Mobile Arena 37
18,310
677,499
105.4%
St. Louis Blues Enterprise Center 35
18,096
633,360
100.0%
Boston Bruins TD Garden 35
17,681
618,835
100.7%
Edmonton Oilers Rogers Place 34
17,533
596,134
94.1%
Minnesota Wild Xcel Energy Center 35
17,472
594,071
97.3%
Nashville Predators Bridgestone Arena 35
17,407
609,253
101.7%
New York Rangers Madison Square Garden 36
17,206
619,450
95.6%
Buffalo Sabres KeyBank Center 35
17,167
600,858
90.7%
Los Angeles Kings Staples Center 34
16,916
575,151
92.8%
Carolina Hurricanes PNC Arena 33
16,905
540,975
90.5%
Columbus Blue Jackets Nationwide Arena 36
16,898
608,354
93.1%
San Jose Sharks SAP Center 36
16,427
591,393
93.5%
Anaheim Ducks Honda Center 36
15,846
570,490
92.3%
Winnipeg Jets Bell MTS Place 37
15,794
584,389
108.2%
New Jersey Devils Prudential Center 34
14,899
506,570
90.2%
Arizona Coyotes Gila River Arena 33
14,605
481,989
85.3%
Florida Panthers BB&T Center 35
14,104
493,671
82.8%
New York Islanders Barclays Center /Nassau Coliseum 35
12,810
448,369
81.3%
Ottawa Senators Canadian Tire Centre 37
12,618
466,876
67.6%
Total
1,082
17,380
18,805,362
Team
Arena
Home Games
Average Attendance
Total Attendance
Capacity Percentage
Chicago Blackhawks
United Center
40
21,399
855,972
108.5%[ 8]
Montreal Canadiens Bell Centre 41
21,046
862,914
98.9%
Philadelphia Flyers Wells Fargo Center 40
19,141
765,622
99.14%
Toronto Maple Leafs Scotiabank Arena 41
19,276
790,316
102.4%
Detroit Red Wings Little Caesars Arena 41
19,120
783,958
98.0%
Tampa Bay Lightning Amalie Arena 41
19,092
782,772
96.9%
Minnesota Wild Xcel Energy Center 41
18,907
775,216
105.3%
Pittsburgh Penguins PPG Paints Arena 41
18,565
761,203
101.0%
Washington Capitals Capital One Arena 41
18,508
758,845
100.0%
Calgary Flames Scotiabank Saddledome 41
18,501
758,550
95.9%
Edmonton Oilers Rogers Place 41
18,347
752,227
98.4%
Vegas Golden Knights T-Mobile Arena 41
18,318
751,067
105.5%
Dallas Stars American Airlines Center 41
18,178
745,314
98.1%
Vancouver Canucks Rogers Arena 41
18,022
738,918
95.3%
Los Angeles Kings Staples Center 41
18,000
738,029
98.7%
Buffalo Sabres KeyBank Center 41
17,908
734,238
93.9%
Boston Bruins TD Garden 41
17,565
720,165
100.0%
Nashville Predators Bridgestone Arena 41
17,445
715,276
101.9%
St. Louis Blues Enterprise Center 41
17,361
711,823
90.7%
New York Rangers Madison Square Garden 41
17,318
710,074
96.2%
San Jose Sharks SAP Center 41
17,266
707,909
98.3%
Colorado Avalanche Pepsi Center 41
17,132
702,446
95.1%
Anaheim Ducks Honda Center 41
16,814
689,385
97.9%
Columbus Blue Jackets Nationwide Arena 41
16,658
682,984
91.8%
Winnipeg Jets Bell MTS Place 40
15,321
612,840
100.0%
New Jersey Devils Prudential Center 40
14,904
596,166
90.3%
Ottawa Senators Canadian Tire Centre 41
14,553
596,684
78.0%
Carolina Hurricanes PNC Arena 41
14,322
587,222
76.7%
Arizona Coyotes Gila River Arena 41
13,989
573,552
81.7%
Florida Panthers BB&T Center 40
12,919
516,754
75.8%
New York Islanders Barclays Center /Nassau Coliseum 41
12,442
510,150
78.9%
Total
1,267
17,377
22,002,081
Notes
The New York Islanders move half of their home schedule to their former arena, Nassau Coliseum, while continuing to play half their home games at Barclays Center.
The Scottrade Center was renamed Enterprise Center.
The Air Canada Centre was renamed Scotiabank Arena.
Totals do not include two outdoor regular-season and international games.
The Chicago Blackhawks hosted the Boston Bruins during the 2019 NHL Winter Classic , played at Notre Dame Stadium in Notre Dame, Indiana , on January 1, 2019.
The Philadelphia Flyers hosted the Pittsburgh Penguins during the 2019 NHL Stadium Series , played at Lincoln Financial Field in Philadelphia on February 23, 2019.
For the 2018 NHL Global Series, the New Jersey Devils and Edmonton Oilers played at the Scandinavium in Gothenburg , Sweden on October 6, 2018, with New Jersey acting as the home team for the game.
For the 2018 NHL Global Series, the Florida Panthers and Winnipeg Jets played two games at Hartwall Arena in Helsinki , Finland on November 1 and 2, 2018, with both teams splitting the hosting duties as the home team.
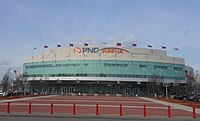
Little Caesars Arena T-Mobile Arena Bridgestone Arena PNC Arena
Team
Arena
Home Games
Average Attendance
Total Attendance
Capacity Percentage
Chicago Blackhawks
United Center
41
21,653
887,794
109.8%[ 9]
Montreal Canadiens Bell Centre 41
21,299
873,283
100.1%
Philadelphia Flyers Wells Fargo Center 41
19,517
800,214
99.9%
Detroit Red Wings Little Caesars Arena 41
19,515
800,115
100.0%
Toronto Maple Leafs Air Canada Centre 41
19,187
786,677
102.0%
Tampa Bay Lightning Amalie Arena 41
19,092
782,772
100.0%
Minnesota Wild Xcel Energy Center 41
19,036
780,501
106.0%
Calgary Flames Scotiabank Saddledome 41
18,905
775,105
98.0%
Washington Capitals Capital One Arena 40
18,774
740,240
104.0%
Pittsburgh Penguins PPG Paints Arena 41
18,579
761,764
101.0%
Buffalo Sabres KeyBank Center 41
18,563
719,283
99.8%
St. Louis Blues Enterprise Center 41
18,356
752,624
95.9%
Edmonton Oilers Rogers Place 41
18,347
752,227
98.4%
Los Angeles Kings Staples Center 41
18,240
747,845
100.1%
Dallas Stars American Airlines Center 41
18,110
742,511
97.7%
Vancouver Canucks Rogers Arena 41
18,078
741,233
95.6%
Vegas Golden Knights T-Mobile Arena 41
18,042
739,740
103.9%
New York Rangers Madison Square Garden 41
17,851
731,899
99.1%
Boston Bruins TD Garden 41
17,565
720,165
100.0%
San Jose Sharks SAP Center 41
17,365
711,988
98.9%
Nashville Predators Bridgestone Arena 41
17,307
709,597
101.1%
Columbus Blue Jackets Nationwide Arena 41
16,659
683,034
91.8%
Anaheim Ducks Honda Center 41
16,635
682,060
96.9%
Ottawa Senators Canadian Tire Centre 40
15,829
615,037
91.1%
Colorado Avalanche Pepsi Center 41
15,586
639,063
87.1%
Winnipeg Jets Bell MTS Place 41
15,321
628,161
102.1%
New Jersey Devils Prudential Center 41
15,200
623,240
92.0%
Florida Panthers BB&T Center 41
13,851
567,897
81.3%
Carolina Hurricanes PNC Arena 41
13,320
546,142
71.3%
Arizona Coyotes Gila River Arena 41
13,040
534,670
76.2%
New York Islanders Barclays Center 41
12,002
492,086
75.9%
Total
1,271
17,446
22,174,263
Notes
The Vegas Golden Knights began their inaugural season at T-Mobile Arena in Paradise, Nevada during the 2017-18 season.
The Detroit Red Wings began play at Little Caesars Arena during the season.
The Verizon Center was renamed Capital One Arena
The MTS Centre was renamed Bell MTS Place
Totals do not include three outdoor regular season games.
The Ottawa Senators hosted the Montreal Canadiens during the NHL 100 Classic , played at TD Place Stadium in Lansdowne Park, Ottawa , on December 16, 2017.
The Buffalo Sabres and New York Rangers played during the 2018 NHL Winter Classic , played at Citi Field in Queens, New York , on January 1, 2018.
The Washington Capitals hosted the Toronto Maple Leafs during the 2018 NHL Stadium Series , played at Navy-Marine Corps Memorial Stadium in Annapolis, Maryland on March 3, 2018.
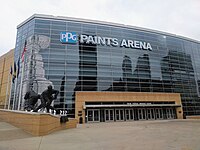
Rogers Place Nationwide Arena PPG Paints Arena Scotiabank Saddledome
Team
Arena
Home Games
Average Attendance
Total Attendance
Capacity Percentage
Chicago Blackhawks
United Center
41
21,751
891,827
110.3%[ 10]
Montreal Canadiens Bell Centre 41
21,288
872,808
100.1%
Detroit Red Wings Joe Louis Arena 41
20,027
821,107
100.0%
Pittsburgh Penguins PPG Paints Arena 41
19,762
810,273
110.2%
Toronto Maple Leafs Air Canada Centre 41
19,744
809,519
107.5%
Philadelphia Flyers Wells Fargo Center 41
19,644
805,408
100.5%
St. Louis Blues Scottrade Center 41
19,539
801,127
104.6%
Tampa Bay Lightning Amalie Arena 41
19,092
782,772
100.0%
Minnesota Wild Xcel Energy Center 41
19,070
781,879
106.2%
Calgary Flames Scotiabank Saddledome 41
18,727
767,829
97.1%
Vancouver Canucks Rogers Arena 41
18,509
758,891
97.9%
Washington Capitals Verizon Center 41
18,506
758,746
100.0%
Edmonton Oilers Rogers Place 41
18,347
752,227
98.4%
Los Angeles Kings Staples Center 41
18,240
747,858
100.1%
Buffalo Sabres KeyBank Center 41
18,141
743,819
94.0%
Dallas Stars American Airlines Center 41
18,102
742,163
97.7%
New York Rangers Madison Square Garden 41
18,020
738,828
100.1%
Boston Bruins TD Garden 41
17,565
720,165
100.0%
San Jose Sharks SAP Center at San Jose 41
17,508
717,833
99.7%
Nashville Predators Bridgestone Arena 41
17,159
703,555
100.3%
Ottawa Senators Canadian Tire Centre 41
16,744
686,534
87.4%
Anaheim Ducks Honda Center 41
15,942
653,632
92.8%
Columbus Blue Jackets Nationwide Arena 41
15,857
650,157
87.5%
Winnipeg Jets MTS Centre 41
15,731
645,004
107.5%
Colorado Avalanche Pepsi Center 41
14,835
608,252
82.4%
Florida Panthers BB&T Center 41
14,620
599,447
85.8%
New Jersey Devils Prudential Center 41
14,567
597,261
88.2%
New York Islanders Barclays Center 41
13,101
537,149
82.9%
Arizona Coyotes Gila River Arena 41
13,094
536,878
76.5%
Carolina Hurricanes PNC Arena 41
11,776
482,829
63.0%
Total
1,230
18,117
21,525,777
Notes:
Barclays Center Rexall Place Joe Louis Arena SAP Center at San Jose
Team
Arena
Home Games
Average Attendance
Total Attendance
Capacity Percentage
Chicago Blackhawks United Center 41
22,859
896,240
110.9% [ 11]
Montreal Canadiens Bell Centre 41
22,288
872,808
100.1%
Detroit Red Wings Joe Louis Arena 41
20,027
821,107
100.0%
Philadelphia Flyers Wells Fargo Center 41
19,228
788,319
98.4%
Toronto Maple Leafs Air Canada Centre 41
19,158
785,485
101.8%
Calgary Flames Scotiabank Saddledome 41
19,145
784,974
99.3%
Tampa Bay Lightning Amalie Arena
41
19,092
782,772
100.0%
Minnesota Wild Xcel Energy Center 40
19,062
762,481
106.1%
Buffalo Sabres First Niagara Center 41
18,590
762,223
97.5%
Pittsburgh Penguins Consol Energy Center 41
18,550
760,584
100.9%
Washington Capitals Verizon Center 41
18,510
758,944
100.0%
St. Louis Blues Scottrade Center 41
18,450
756,483
96.3%
Vancouver Canucks Rogers Arena 41
18,431
755,677
97.5%
Dallas Stars American Airlines Center 41
18,376
753,452
99.2%
Los Angeles Kings Staples Center 41
18,274
749,234
100.2%
Ottawa Senators Canadian Tire Centre 41
18,084
741,472
94.4%
New York Rangers Madison Square Garden 41
18,006
738,246
100.0%
Boston Bruins TD Garden 40
17,565
702,600
100.0%
Nashville Predators Bridgestone Arena 41
16,971
695,828
99.2%
Edmonton Oilers Rexall Place 41
16,841
690,499
100.0%
San Jose Sharks SAP Center at San Jose 41
16,746
686,623
95.4%
Anaheim Ducks Honda Center 41
16,336
669,805
95.1%
Colorado Avalanche Pepsi Center 40
16,206
648,232
90.0%
Florida Panthers BB&T Center 41
15,384
630,746
90.3%
Winnipeg Jets MTS Centre 41
15,294
627,054
101.9%
New Jersey Devils Prudential Center 41
15,073
618,029
91.3%
Columbus Blue Jackets Nationwide Arena 41
14,665
601,293
80.8%
New York Islanders Barclays Center 41
13,626
558,705
86.2%
Arizona Coyotes Gila River Arena 41
13,433
550,763
78.4%
Carolina Hurricanes PNC Arena 41
10,102
500,363
65.6%
Total
1,227
17,482
21,451,041
Notes:
Gila River Arena Honda Center Prudential Center Rogers Arena
Team
Arena
Home Games
Average Attendance
Total Attendance
Capacity Percentage
Chicago Blackhawks United Center 41
21,769
892,532
110.4% [ 12]
Montreal Canadiens Bell Centre 41
21,286
872,752
100.1%
Detroit Red Wings Joe Louis Arena 41
20,027
821,107
100.0%
Philadelphia Flyers Wells Fargo Center 41
19,270
790,107
98.6%
Calgary Flames Scotiabank Saddledome 41
19,097
782,977
99.0%
Toronto Maple Leafs Air Canada Centre 41
19,062
781,576
101.3%
Minnesota Wild Xcel Energy Center 41
19,023
779,944
106.0%
Tampa Bay Lightning Amalie Arena
41
18,823
771,761
98.0%
Vancouver Canucks Rogers Arena 41
18,710
767,149
98.9%
Pittsburgh Penguins Consol Energy Center 41
18,617
763,319
101.3%
Washington Capitals Verizon Center 40
18,506
740,240
100.0%[ 29]
Buffalo Sabres First Niagara Center 41
18,580
761,809
97.4%
St. Louis Blues Scottrade Center 41
18,545
760,349
96.8%
Los Angeles Kings Staples Center 41
18,265
748,893
100.2%
Ottawa Senators Canadian Tire Centre 41
18,246
748,112
95.3%
New York Rangers Madison Square Garden 41
18,006
738,246
100.0%
Boston Bruins TD Garden 41
17,565
720,165
100.0%
San Jose Sharks SAP Center at San Jose 40
17,420
696,807
99.6%[ 29]
Dallas Stars American Airlines Center 41
17,350
711,359
93.6%
Anaheim Ducks Honda Center 41
16,874
691,835
98.3%
Nashville Predators Bridgestone Arena 41
16,854
691,028
98.5%
Edmonton Oilers Rexall Place 41
16,839
690,399
100.0%
Colorado Avalanche Pepsi Center 41
16,176
663,247
89.8%
Columbus Blue Jackets Nationwide Arena 41
15,511
635,973
85.5%
New York Islanders Nassau Veterans Memorial Coliseum 41
15,334
628,729
94.8%
New Jersey Devils Prudential Center 41
15,189
622,783
86.2%
Winnipeg Jets MTS Centre 41
15,037
616,556
100.2%
Arizona Coyotes Gila River Arena 41
13,345
547,149
77.9%
Carolina Hurricanes PNC Arena 41
12,594
516,375
67.4%
Florida Panthers BB&T Center 41
11,265
461,877
66.1%
Total
1,228
17,439
21,415,155
Notes:
Staples Center Madison Square Garden PNC Arena BB&T Center
Team
Arena
Home Games
Average Attendance
Total Attendance
Capacity Percentage
Chicago Blackhawks United Center 41
22,623
927,545
117.6% [ 13]
Detroit Red Wings Joe Louis Arena 41
22,149
908,131
110.4%
Montreal Canadiens Bell Centre 41
21,273
872,193
100.0%
Philadelphia Flyers Wells Fargo Center 41
19,839
813,411
101.5%
Vancouver Canucks Rogers Arena 41
19,770
810,594
107.2%
Toronto Maple Leafs Air Canada Centre 41
19,446
797,310
103.3%
Calgary Flames Scotiabank Saddledome 41
19,302
791,389
100.1%
Los Angeles Kings Staples Center 41
19,017
779,734
107.6%
Pittsburgh Penguins Consol Energy Center 41
18,618
763,344
101.3%
Tampa Bay Lightning Tampa Bay Times Forum 41
18,612
763,096
96.9%
Buffalo Sabres First Niagara Center 41
18,579
761,767
97.4%
Minnesota Wild Xcel Energy Center 41
18,505
758,729
103.1%
Ottawa Senators Canadian Tire Centre 41
18,108
742,468
94.5%
Washington Capitals Verizon Center 41
18,054
740,240
97.6%
New York Rangers Madison Square Garden 41
18,006
738,246
100.0%
Boston Bruins TD Garden 41
17,565
720,165
100.0%
San Jose Sharks SAP Center at San Jose 41
17,133
702,480
97.6%
St. Louis Blues Scottrade Center 41
17,025
698,059
88.9%
Edmonton Oilers Rexall Place 41
16,828
689,949
99.9%
Nashville Predators Bridgestone Arena 41
16,600
680,619
97.0%
Anaheim Ducks Honda Center 41
16,469
675,248
95.9%
Colorado Avalanche Pepsi Center 41
16,295
668,133
90.5%
Carolina Hurricanes PNC Arena 41
15,483
634,832
82.9%
New Jersey Devils Prudential Center 41
15,257
625,570
88.7%
Winnipeg Jets MTS Centre 41
15,004
615,164
100.0%
New York Islanders Nassau Veterans Memorial Coliseum 41
14,740
604,362
93.4%
Columbus Blue Jackets Nationwide Arena 41
14,698
602,619
81.0%
Dallas Stars American Airlines Center 41
14,658
601,008
79.1%
Florida Panthers BB&T Center 41
14,177
581,286
83.2%
Phoenix Coyotes Jobing.com Arena 41
13,775
564,798
80.4%
Total
1,230
17,587
21,632,479
Notes:
First Niagara Center Amalie Arena MTS Centre American Airlines Center
Team
Arena
Home Games
Average Attendance
Total Attendance
Capacity Percentage
Chicago Blackhawks United Center 24
21,755
522,619
110.4% [ 14]
Montreal Canadiens Bell Centre 24
21,273
510,552
100.0%
Detroit Red Wings Joe Louis Arena 24
20,066
481,584
100.0%
Philadelphia Flyers Wells Fargo Center 24
19,786
474,878
101.3%
Toronto Maple Leafs Air Canada Centre 24
19,426
466,224
103.2%
Ottawa Senators Scotiabank Place 24
19,408
465,801
101.3%
Calgary Flames Scotiabank Saddledome 24
19,289
462,936
100.0%
Tampa Bay Lightning Tampa Bay Times Forum 24
19,055
457,337
99.2%
Buffalo Sabres First Niagara Center 24
18,970
455,290
99.5%
Vancouver Canucks Rogers Arena 24
18,947
454,740
100.2%
Minnesota Wild Xcel Energy Center 24
18,794
451,075
104.7%
Pittsburgh Penguins Consol Energy Center 24
18,648
447,560
101.4%
Los Angeles Kings Staples Center 24
18,178
436,295
100.3%
Washington Capitals Verizon Center 24
17,734
425,638
95.8%
Boston Bruins TD Garden 24
17,565
421,560
100.0%
San Jose Sharks HP Pavilion at San Jose 24
17,561
421,472
100.0%
Carolina Hurricanes PNC Arena 24
17,558
421,401
94.0%
St. Louis Blues Scottrade Center 24
17,263
414,328
90.1%
New York Rangers Madison Square Garden 24
17,200
412,800
100.0%
New Jersey Devils Prudential Center 24
17,114
410,739
97.1%
Dallas Stars American Airlines Center 24
17,063
409,521
92.1%
Florida Panthers BankAtlantic Center 24
16,991
407,806
99.7%
Nashville Predators Bridgestone Arena 24
16,974
407,386
99.2%
Edmonton Oilers Rexall Place 24
16,839
404,136
100.0%
Anaheim Ducks Honda Center 24
15,887
381,308
92.5%
Colorado Avalanche Pepsi Center 24
15,444
370,677
85.8%
Winnipeg Jets MTS Centre 24
15,004
360,096
100.0%
Columbus Blue Jackets Nationwide Arena 24
14,564
349,558
80.3%
Phoenix Coyotes Jobing.com Arena 24
13,923
334,165
81.3%
New York Islanders Nassau Veterans Memorial Coliseum 24
13,306
319,362
82.3%
Total
720
17,721
12,758,849
Scotiabank Place United Center Pepsi Center Verizon Center
Team
Arena
Home Games
Average Attendance
Total Attendance
Capacity Percentage
Chicago Blackhawks United Center 41
21,533
882,874
109.2% [ 15]
Montreal Canadiens Bell Centre 41
21,273
872,193
100.0%
Philadelphia Flyers Wells Fargo Center 40
19,770
790,787
101.2%
Detroit Red Wings Joe Louis Arena 41
20,066
822,706
100.0%
Toronto Maple Leafs Air Canada Centre 41
19,505
799,686
103.6%
Ottawa Senators Scotiabank Place 41
19,357
793,612
101.1%
Calgary Flames Scotiabank Saddledome 41
19,289
790,849
100.0%
Vancouver Canucks Rogers Arena 41
18,884
774,250
100.1%
St. Louis Blues Scottrade Center 41
18,810
771,207
98.2%
Buffalo Sabres First Niagara Center 40
18,680
747,209
99.9%
Pittsburgh Penguins Consol Energy Center 41
18,569
761,224
101.0%
Washington Capitals Verizon Center 41
18,506
758,746
100.0%
Tampa Bay Lightning Tampa Bay Times Forum 41
18,468
757,192
96.2%
New York Rangers Madison Square Garden 41
18,191
745,852
99.9%
Los Angeles Kings Staples Center 39
18,109
706,236
99.9%
Minnesota Wild Xcel Energy Center 41
17,772
728,683
98.4%
Boston Bruins TD Garden 41
17,565
720,165
100.0%
San Jose Sharks HP Pavilion at San Jose 41
17,562
720,042
100.0%
Edmonton Oilers Rexall Place 41
16,839
690,399
100.0%
Nashville Predators Bridgestone Arena 41
16,691
684,324
97.5%
Florida Panthers BankAtlantic Center 41
16,628
681,763
86.4%
Carolina Hurricanes PNC Arena 41
16,043
657,747
85.9%
Colorado Avalanche Pepsi Center 41
15,499
635,440
86.1%
New Jersey Devils Prudential Center 41
15,397
631,258
87.4%
Winnipeg Jets MTS Centre 41
15,004
615,164
100.0%
Anaheim Ducks Honda Center 40
14,784
591,371
86.1%
Columbus Blue Jackets Nationwide Arena 41
14,660
601,061
80.1%
Dallas Stars American Airlines Center 41
14,227
583,306
76.8%
New York Islanders Nassau Veterans Memorial Coliseum 41
13,191
540,838
81.3%
Phoenix Coyotes Jobing.com Arena 41
12,421
509,241
72.3%
Total
1,225
17,441
21,365,425
Notes:
See also
References
Information related to List of National Hockey League attendance figures


